CONTENT!
Posted on Leave a comment

Excel tip: Making the most of Excel’s conditional formatting

How To Make The Most Out Of Excel's Conditional Formatting - Excel Tips

There is so much you can do with conditional formatting in Excel, and you will save yourself a lot of time in the long term if you take a little time to learn a few tricks. If you are new to conditional formatting, one quite easy feature to get you started is highlighting duplicated data.

CONTENT! CONTENT!
Posted on Leave a comment

Excel tip: How to create related tables in PowerPivot

Inclusive-Leadership

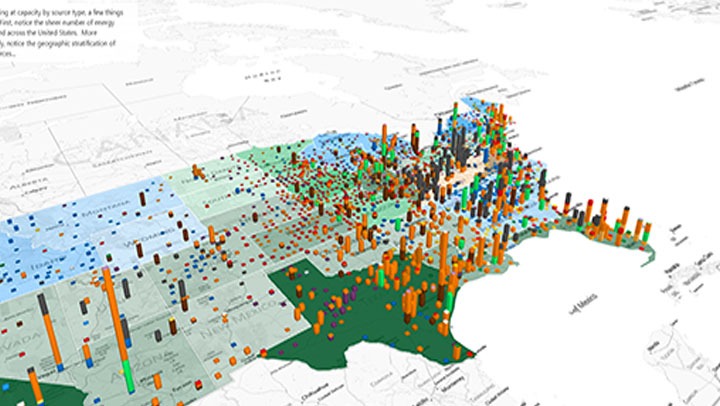
PowerPivot is used to for connecting and manipulating data, particularly from external sources. It allows you to connect tables of data that have common fields (just like a relational database) and is just one of the features you will learn about in our Excel Advanced Data Analysis course.

CONTENT! CONTENT! CONTENT!
Posted on Leave a comment

Excel tip: Generate a pivot chart with a slicer

How to Generate A Pivot Chart With A Slicer - Excel Tips - Screenshot of a Chart on Excel

A PivotChart is an interactive chart that provides a graphical analysis of data. Your data comes from existing tables, databases or PivotTable reports. A slicer is a visual filter that allows further insight into a particular field. You can learn more about PivotCharts in our Excel Advanced and Excel Advanced Pivot Tables courses.

CONTENT!
Posted on Leave a comment

Excel tip: How to create a drop-down list in Excel

Excel Drop Down List

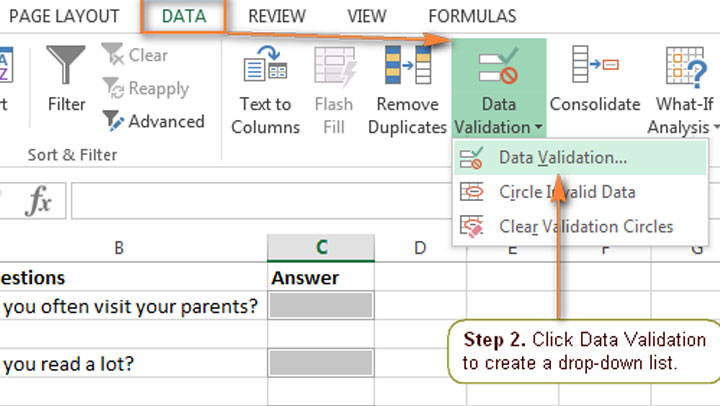
In this video, you will learn how to create a drop-down so you can select from a list without having to retype each time. In this example, we have a simple database with a Department field and will create a list of departments as the drop-down list.

CONTENT!